
With some spare cash in my current account, I’ve started exploring investing in individual stocks and ETFs more seriously. To begin putting your money into these investments, most investors would have already heard of the lump-sum investing and dollar-cost averaging (DCA) strategies.
What are they?
As their names suggest, lump-sum investing simply means investing all your money into an asset at the same time, while DCA means investing smaller amounts of money at regular intervals, over a period of time.
There are pros and cons to each approach, with a key difference being risk management. According to this Fidelity article:
[DCA] potentially [helps] reduce the impact of volatility on the overall [asset] purchase. This can serve as a risk management trading strategy if you end up buying more when the price is relatively lower and buying less when the price is relatively higher.
As I’m uninterested in timing the market (i.e. trying to outsmart other investors by speculating when to buy low and sell high — which in this case would make lump-sum investing a good strategy), DCA sounded like a great strategy as I minimise my transaction risks while I get exposure to the stock markets.
Andrei Jikh (who’s currently my favourite finance Youtuber) talked about investing US$100 👏🏼every👏🏼day👏🏼 into the VTI and SCHD ETFs here.
But what’s the catch?
DCA has a big drawback, especially for retail investors who are looking to invest small amounts of money in regular intervals.
You could be better off accumulating your money into bigger amounts before investing in longer intervals, e.g. investing $2000 every 2 months, instead of investing $1000 every month. If lump-sum investing and DCA are two ends of a spectrum, the optimal spot for a (risk-averse) investor is at neither ends, and where on the spectrum depends on your own risk appetite. DCA is not a catch-all for the risk-averse because of 💲transaction costs💲.
When transaction costs come into play
Depending on the broker you’re transacting your assets through, they have various kinds of fee models. For simplicity, I’m expressing transaction costs as a proportion of the monthly investment amount, so there is no need to consider fees separately (e.g. buying fees, management fees, currency conversion…).
To visualise the impact of transaction costs, we’ll compare how a portfolio with no cost differs from those with costs. The graph below shows 4 portfolios:
- Portfolio 1 (in black): The investor invests $5000 every month with no monthly transaction costs. Zero transactional cost will never hold true in reality, so this portfolio is just a hypothetical benchmark.
- Portfolio 2 (in orange): The investor invests $5000 every month, but with 0.1% of investment value as transaction cost, which works out to be $5 every month.
- Portfolio 3 (in green): $5000 investment every month, 1% transaction cost, which works out at $50 every month.
- Portfolio 4 (in blue): $ 5000 investment every month, 10% transaction cost, which works out at $500 every month.
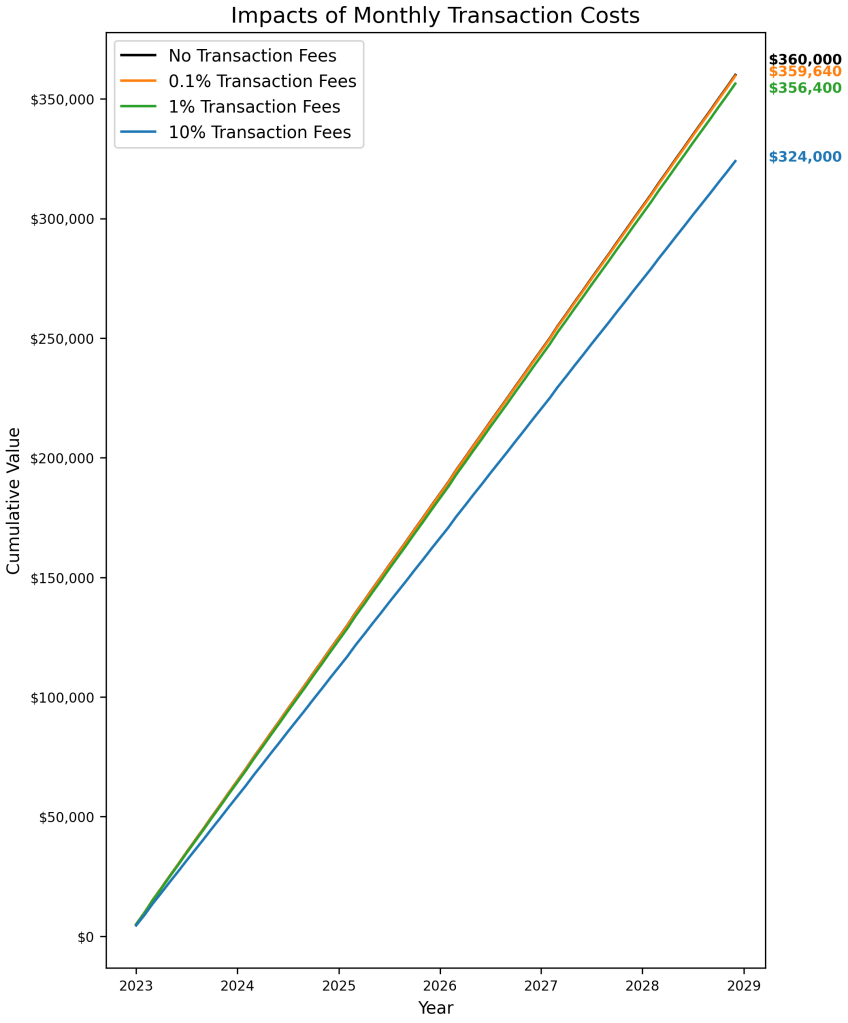
By the end of 6 years, Portfolio 1 (with no cost) ended at $360,000, Portfolio 2 (0.1% cost) ended at $359,960, Portfolio 3 (1% cost) ended at $356,400 and Portfolio 4 (10% cost) ended at $324,000.
In percentages, Portfolio 2 has performed 0.1% worse than Portfolio 1, Portfolio 3 has performed 1% worse than Portfolio 1, and Portfolio 4 has performed 10% worse than Portfolio 1. (Perhaps) Surprisingly, the differences in portfolio performance are the same as the percentage-point differences between the transaction costs.
In other words, your DCA strategy will perform x% worse than the best hypothetical DCA strategy, and x% is your transaction cost as a percentage of your investment amount at each interval.
What if I include a principal and projected returns?
The previous example assumed $0 initial investment and 0% growth in the money invested. The next graph shows the same portfolios, but with an initial $100,000 investment (also subjected to investment costs), and 6% annual growth in money invested.
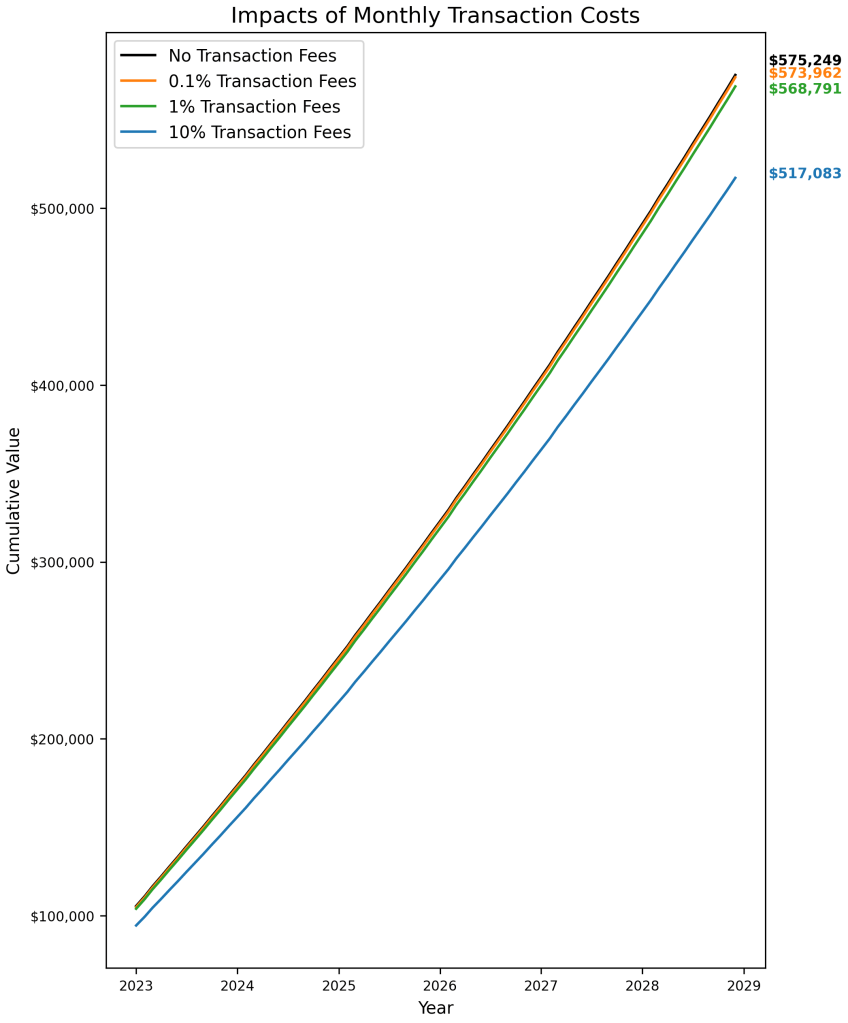
The conclusion stays the same, where the differences in performance is simply the percentage-point differences between the transaction costs of the portfolios.
Pay attention to your transaction costs
Given that the key differentiator between DCA strategies is how low we can push the transaction costs as a percentage of the investment amount, it’s crucial to get the correct view of transaction costs each time we make a purchase.
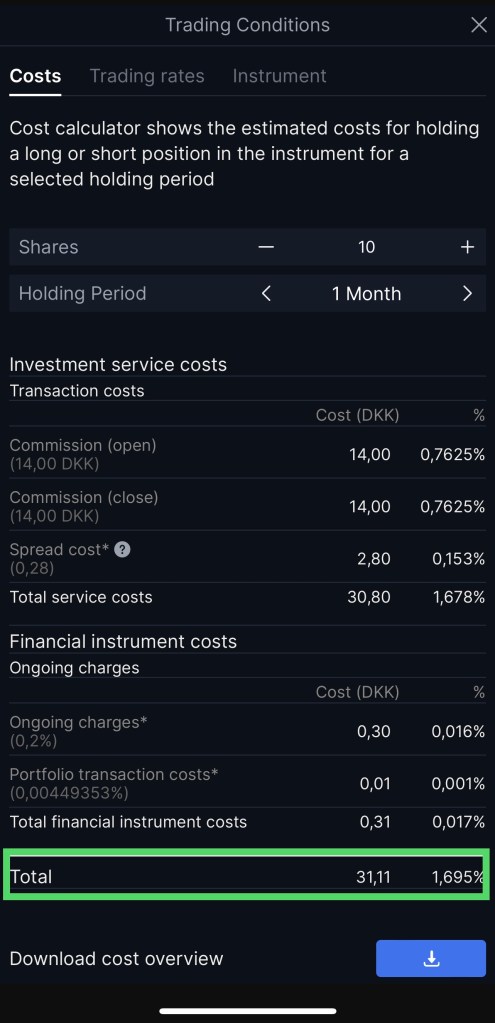
I can’t speak for all brokerage apps, but this is what I see when I try to buy an ETF through my bank:
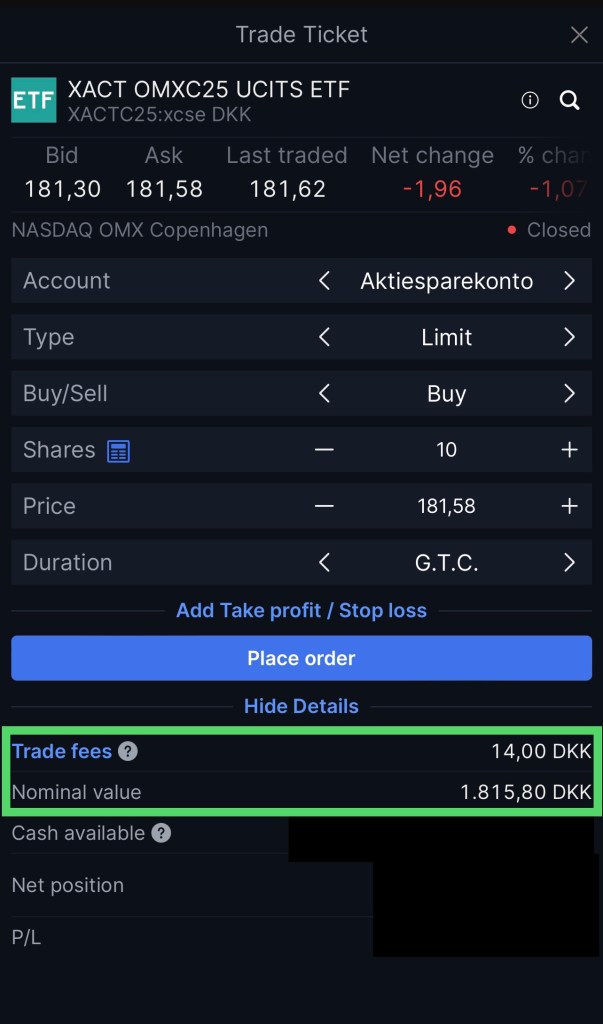
While it’s tempting to simply calculate my transaction cost here as 14/1815.8 * 100% = 0.771%, a more realistic amount is in fact 1.695%, and arriving at this number involved a few more clicks in the app.
Another important implication of miscalculating your transaction cost is having a cost-to-investment ratio so high that the investment takes a long time to hit breakeven.
In a nutshell
Always consider your transaction cost as a percentage of your total transaction amount at each DCA interval.
If we consider purely in absolute amounts, while a transaction cost of $5000 might raise alarm bells, we might start thinking that a transaction cost of $10 is acceptable or even cheap. This is not entirely true.
If a stock costs $100 while you have to pay $10 in transactional cost, this translates to 10% of the investment amount. Consistently paying 10% in transaction costs means losing out substantially to other DCA strategies (which becomes a hefty amount when more money is involved) and the investment having to make 10% before turning a profit.
