Tag: Finance

  • Managing My Finances as an Expat

    Managing My Finances as an Expat

    As a Singaporean living and working in Denmark, having bank accounts, savings and expenses both in Denmark and Singapore have made tracking my finances somewhat complicated.

    Money gets transferred across geographies… I earn, save and spend across different accounts… and waters get even muddier when I no longer just keep cash in the bank, but also invest in stocks and bonds.

    What are people saying?

    I knew I had to keep a close eye on my finances. Quick Googling suggests these for emergency funds and holding cash:

    • Emergency fund: Keep 3 to 6 months’ worth of essential living expenses in a liquid savings account.
    • Portfolio cash: Limit general cash or cash equivalents to roughly 2% to 10% of your total investment portfolio unless you have a major purchase planned within 12 to 24 months.

    CNBC also recommends retirement benchmarks by decades:

    • Age 30: 1x your annual salary
    • Age 40: 3x your annual salary
    • Age 50: 6x your annual salary
    • Age 60: 8x your annual salary
    • Age 67: 10x your annual salary

    But my numbers were everywhere in different accounts, different currencies, and they fluctuate depending on market conditions. I usually only had a hunch of how much I made and how much I spent, but nothing precise about my net-worth.

    How do I get an overview of everything?

    I started with a simple Excel file that slowly got more complicated. And I’m sharing a simple version of my Excel file in this post.

    I’ve used it over a few years. It has kept me on my toes all this while, and I get to do extra shopping 🛍 or have a couple extra takeouts 🥡 without guilt when I can see that I (or mostly the market) have made a good month of savings.

    In adult (and boring) terms, I could also start having clearer ideas and projections about when a home or big-ticket purchases become plausible, with such an overview.

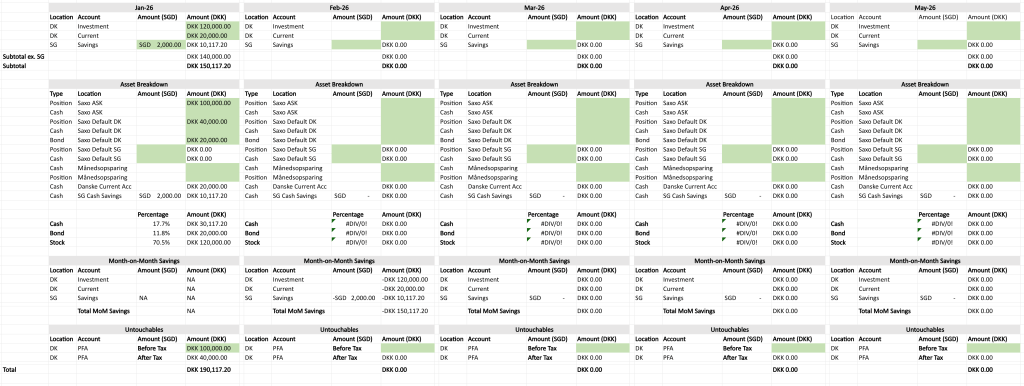
    The Excel file looks like this:
    And it’s available ✨ here ✨

    What are we looking at?

    From left to right, I track my finances at the start of every month, so 12 repetitions of the same set of cells for a whole year.

    From top to bottom, I start with a quick glance of all my money across my 3 accounts (2 in Denmark, 1 in Singapore), before diving into the breakdown across all these accounts.

    Month-on-month savings show the savings (or losses) made from the current month to the previous month. Untouchables is money I have in my Danish pension that is not immediately available, hence the name.

    I have accounts in 2 currencies, hence the SGD and DKK columns, and I eventually sum them up in DKK, since I’m financially more active in Denmark.

    The Quick Overview
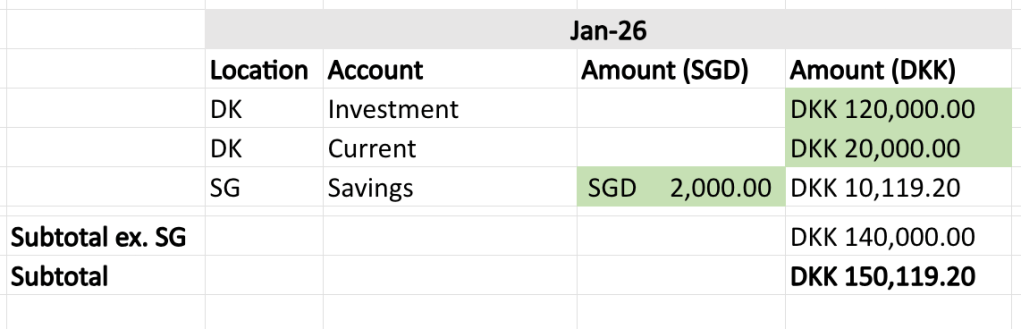
    Each row is just the amount of money I have in each of my bank account. The green cells are where I input amounts of money, either in SGD or DKK, and they get summed up automatically in DKK in the subtotal rows.

    Asset Breakdown
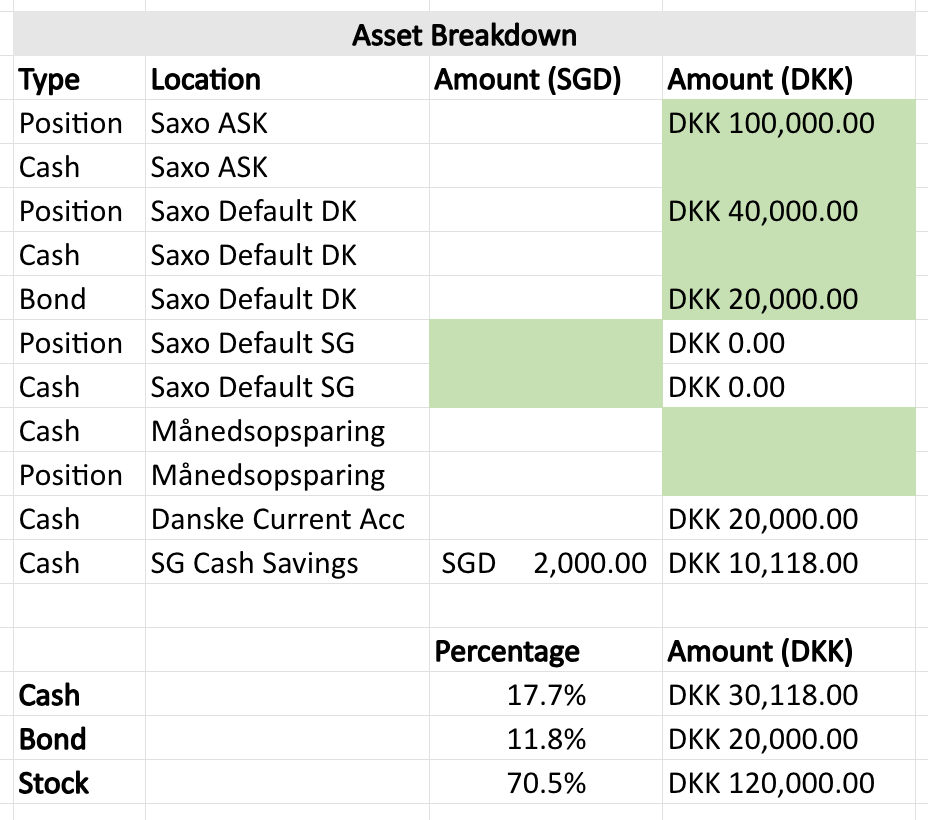
    The breakdown gets a bit more interesting. This depends on brokerages, but the brokerage that I’m using lets me see values in different sub-accounts I have with them, differentiated by cash and positions held.

    Each row represents the type of asset I have in each sub-account and the value of them. A slight complication here: I need to know the breakdown across my cash, stocks and bonds, but my brokerage doesn’t explicitly show the breakdown between the values of stocks and bonds I own.

    I’ve therefore chosen to record whatever I see from my brokerage app under cash and position –where position is the sum of both stock and bond values — and then record my bonds’ value in a different row to separate them out from the stocks in the next calculations.

    I then calculate the percentage breakdown of my assets for the month. From this I get to see if I’m holding too much cash based on the 3-6 months of expenses recommendation or owning too many shares for my own risk appetite.

    The Rest
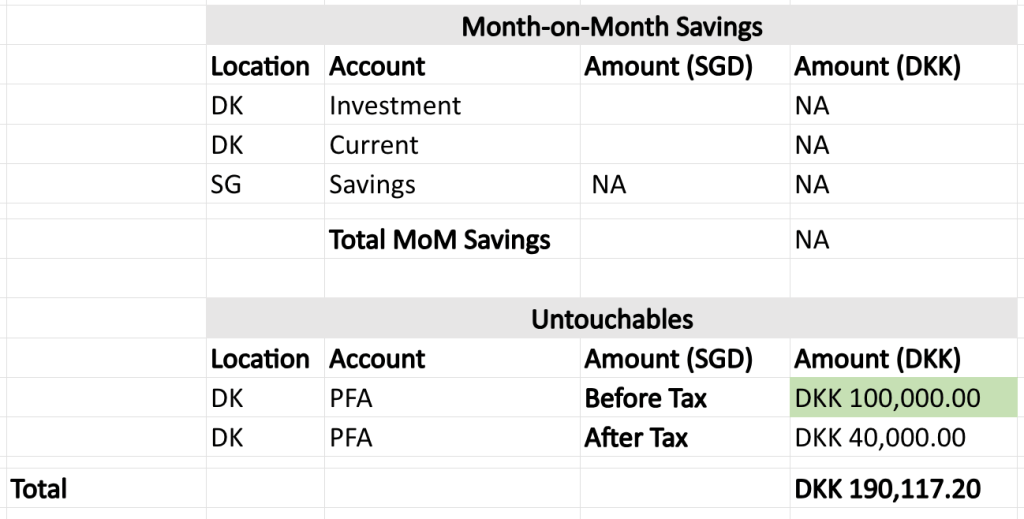
    Month-on-month savings shows how much value in each account changed from the current month to the last month.

    Untouchables describe the amount of money I have in my pension in Denmark. If I do choose to permanently leave Denmark before retirement age, I receive the money after paying taxes, hence the before and after tax rows. The last row describes the total amount of money that is mine (but also not really mine yet).

    Add-ons

    This file is the simplest version for how I keep an overview of all my money across different accounts and currencies. It’s a fairly simple exercise to add more rows if you have more accounts, and more columns if you deal with more currencies.

    In my own copy, I’ve also tried gamifying the process. I added quarterly goals at the start of each quarter and reminders for myself how much “work” needs to be done in the next months to hit my targets.

    Caveats

    I’ve seen other content creators deciding to exclude unrealised gains and losses as part of their tracking. That exercise however is too cumbersome and less meaningful to me, as I still use the month-on-month movements to decide how much or less to invest.

    I currently also have no debts, so I have not accounted for any.

    An even better overview?

    My process is still a highly manual one, and I would ideally love to have an app that can automatically tap into my bank accounts and give me a customised view of my assets. In fact, it sounds like Singapore already has one (OCBC OneView):
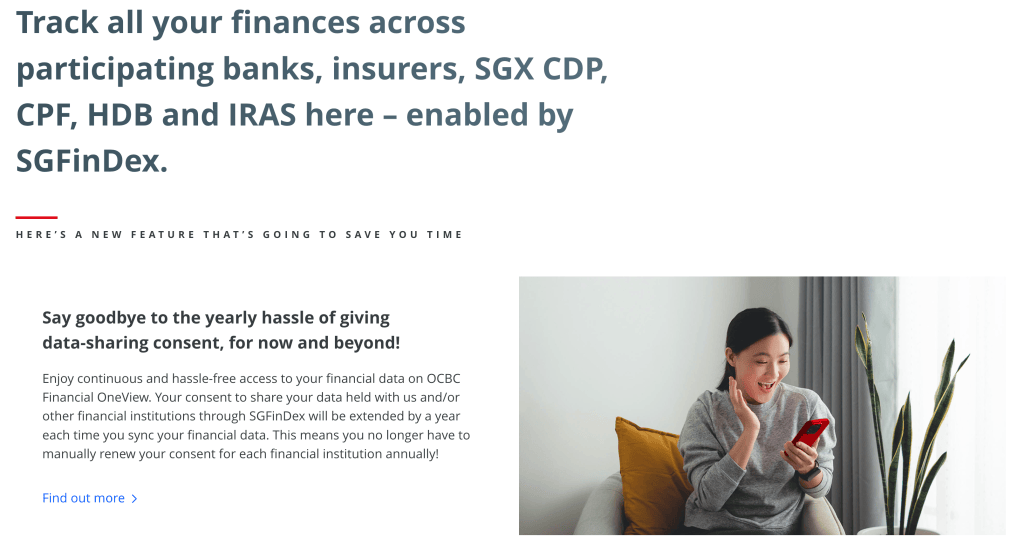
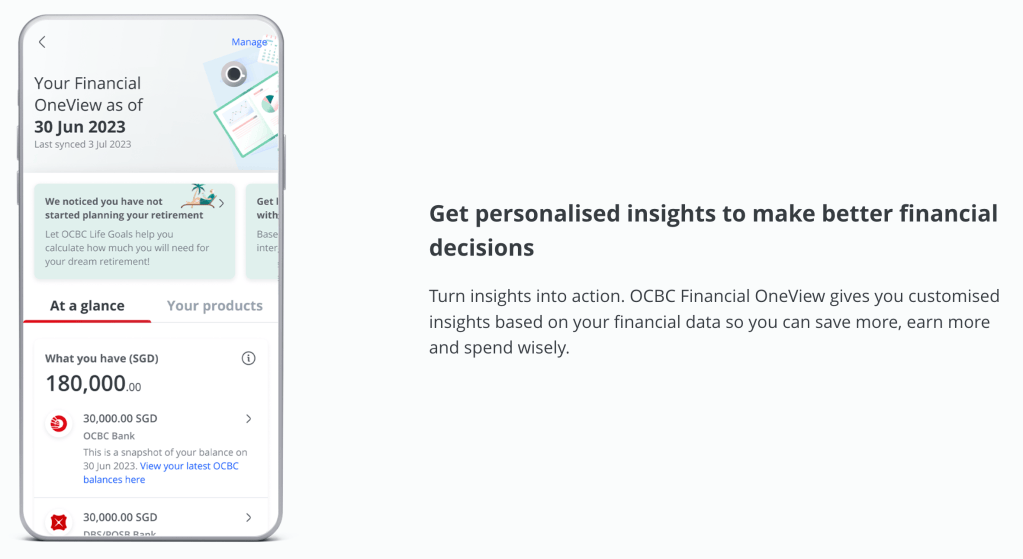
    And it sounds amazing, with overviews not just on net-worth based on cash and stock market positions, but also insurance policies, home loans, taxes…

    For the Singaporeans using the financial OneView, how is that going for you?

    Is there a Danish version?

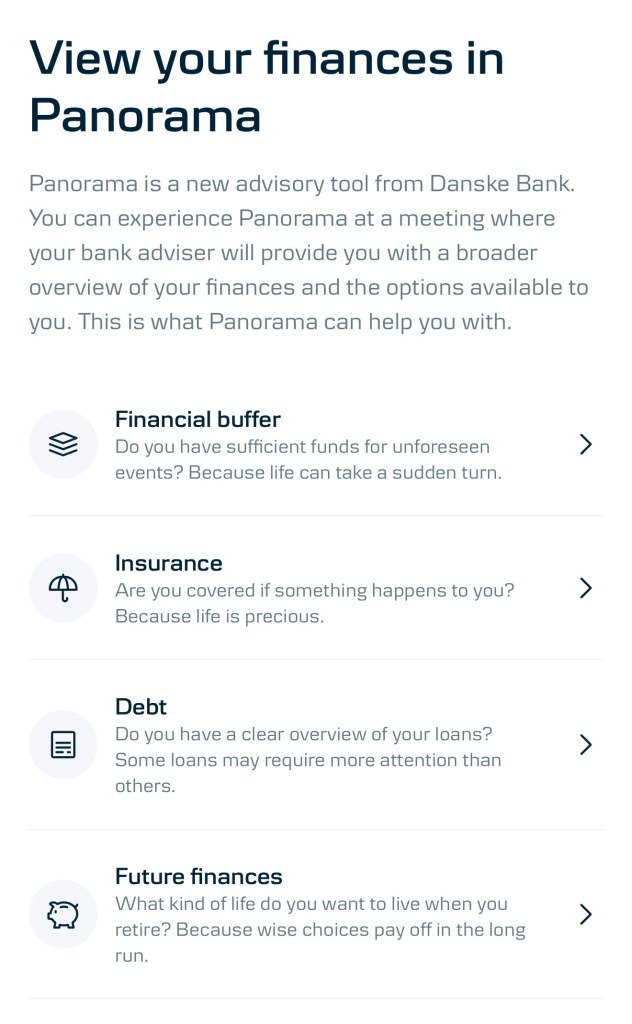
    I’ve heard about the Panorama tool by Danske Bank, and it reads like it’s a financial advisory tool for them to recommend optimising asset allocation, loan structuring, future planning etc., more than a financial tracking tool just for keeping an overview.

    Thoughts if you’ve used it? 🧐

    In sum

    I’ve been tracking my finances, the process works for me, but it could be so much better. If you’re new to the process, feel free to use the Excel file shared above. If not, I’d love to hear what your process is and if there’s something I’m missing out on, especially in the Danish context, I’d love to hear your thoughts. 🤩

  • The Extra Cost in Dollar Cost Average Investing?

    The Extra Cost in Dollar Cost Average Investing?

    With some spare cash in my current account, I’ve started exploring investing in individual stocks and ETFs more seriously. To begin putting your money into these investments, most investors would have already heard of the lump-sum investing and dollar-cost averaging (DCA) strategies.

    What are they?

    As their names suggest, lump-sum investing simply means investing all your money into an asset at the same time, while DCA means investing smaller amounts of money at regular intervals, over a period of time.

    There are pros and cons to each approach, with a key difference being risk management. According to this Fidelity article:

    [DCA] potentially [helps] reduce the impact of volatility on the overall [asset] purchase. This can serve as a risk management trading strategy if you end up buying more when the price is relatively lower and buying less when the price is relatively higher.

    As I’m uninterested in timing the market (i.e. trying to outsmart other investors by speculating when to buy low and sell high — which in this case would make lump-sum investing a good strategy), DCA sounded like a great strategy as I minimise my transaction risks while I get exposure to the stock markets.

    Andrei Jikh (who’s currently my favourite finance Youtuber) talked about investing US$100 👏🏼every👏🏼day👏🏼 into the VTI and SCHD ETFs here.

    But what’s the catch?

    DCA has a big drawback, especially for retail investors who are looking to invest small amounts of money in regular intervals.

    You could be better off accumulating your money into bigger amounts before investing in longer intervals, e.g. investing $2000 every 2 months, instead of investing $1000 every month. If lump-sum investing and DCA are two ends of a spectrum, the optimal spot for a (risk-averse) investor is at neither ends, and where on the spectrum depends on your own risk appetite. DCA is not a catch-all for the risk-averse because of 💲transaction costs💲.

    When transaction costs come into play

    Depending on the broker you’re transacting your assets through, they have various kinds of fee models. For simplicity, I’m expressing transaction costs as a proportion of the monthly investment amount, so there is no need to consider fees separately (e.g. buying fees, management fees, currency conversion…).

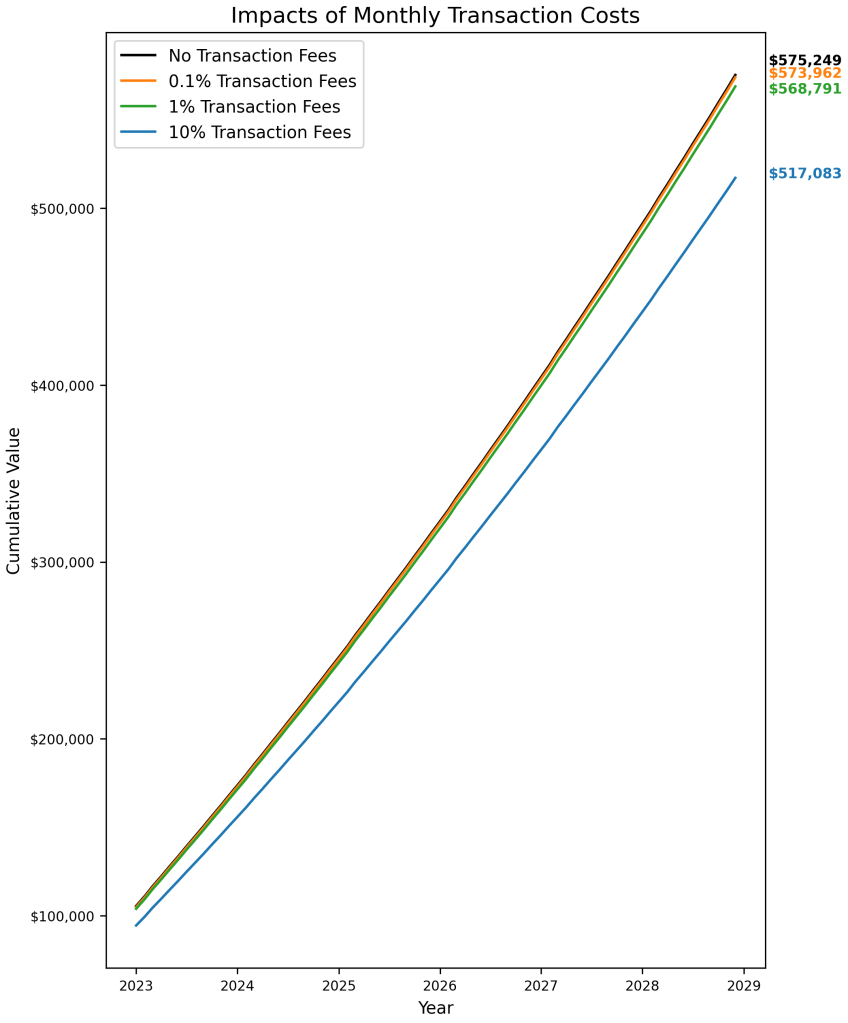
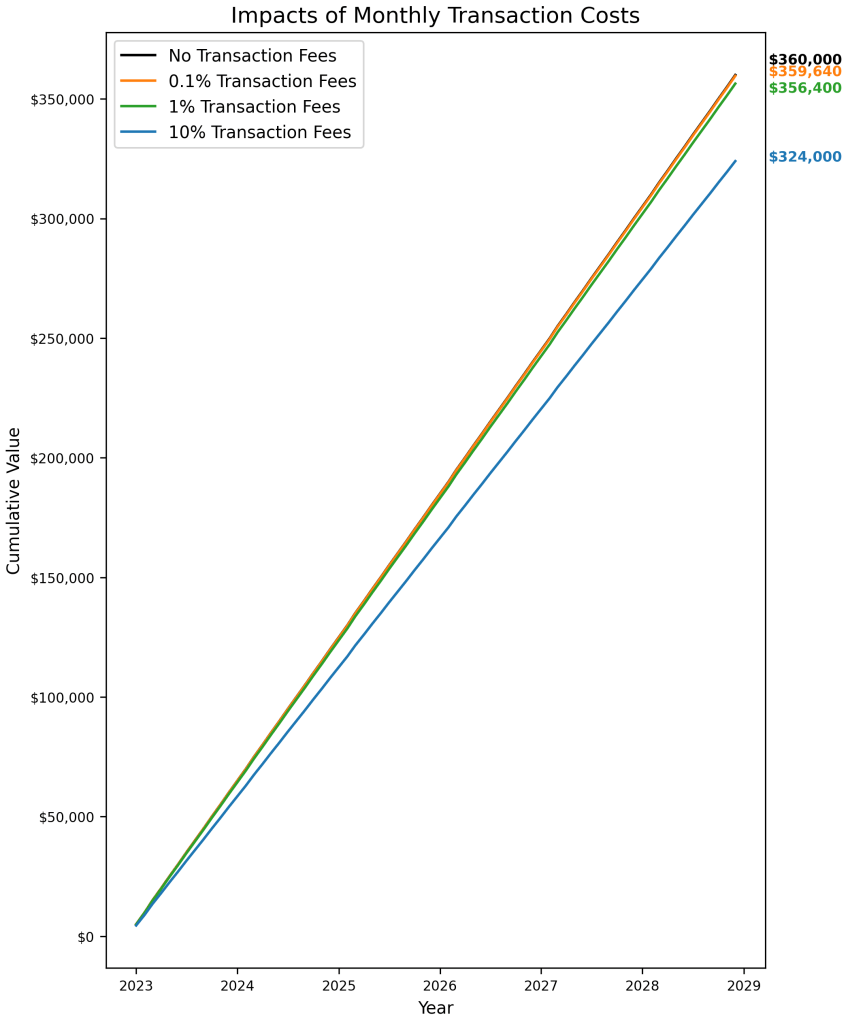
    To visualise the impact of transaction costs, we’ll compare how a portfolio with no cost differs from those with costs. The graph below shows 4 portfolios:

    • Portfolio 1 (in black): The investor invests $5000 every month with no monthly transaction costs. Zero transactional cost will never hold true in reality, so this portfolio is just a hypothetical benchmark.
    • Portfolio 2 (in orange): The investor invests $5000 every month, but with 0.1% of investment value as transaction cost, which works out to be $5 every month.
    • Portfolio 3 (in green): $5000 investment every month, 1% transaction cost, which works out at $50 every month.
    • Portfolio 4 (in blue): $ 5000 investment every month, 10% transaction cost, which works out at $500 every month.
    Difference between portfolios is the percentage-point difference in transaction costs

    By the end of 6 years, Portfolio 1 (with no cost) ended at $360,000, Portfolio 2 (0.1% cost) ended at $359,960, Portfolio 3 (1% cost) ended at $356,400 and Portfolio 4 (10% cost) ended at $324,000.

    In percentages, Portfolio 2 has performed 0.1% worse than Portfolio 1, Portfolio 3 has performed 1% worse than Portfolio 1, and Portfolio 4 has performed 10% worse than Portfolio 1. (Perhaps) Surprisingly, the differences in portfolio performance are the same as the percentage-point differences between the transaction costs.

    In other words, your DCA strategy will perform x% worse than the best hypothetical DCA strategy, and x% is your transaction cost as a percentage of your investment amount at each interval.

    What if I include a principal and projected returns?

    The previous example assumed $0 initial investment and 0% growth in the money invested. The next graph shows the same portfolios, but with an initial $100,000 investment (also subjected to investment costs), and 6% annual growth in money invested.

    Difference between portfolios is still just the percentage-point differences in transaction costs

    The conclusion stays the same, where the differences in performance is simply the percentage-point differences between the transaction costs of the portfolios.

    Pay attention to your transaction costs

    Given that the key differentiator between DCA strategies is how low we can push the transaction costs as a percentage of the investment amount, it’s crucial to get the correct view of transaction costs each time we make a purchase.

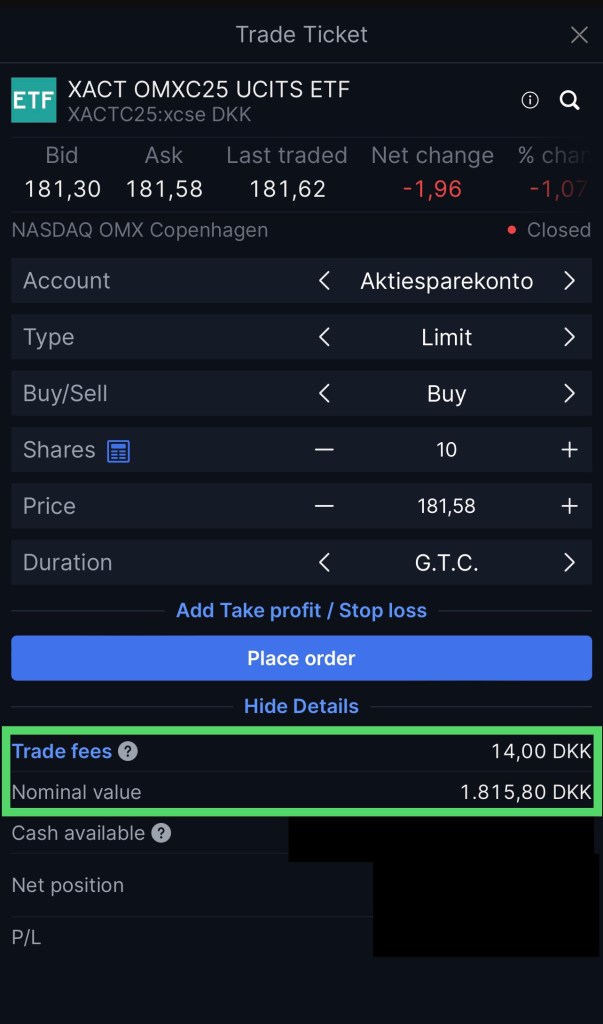
    I can’t speak for all brokerage apps, but this is what I see when I try to buy an ETF through my bank:

    Transaction costs at first glance

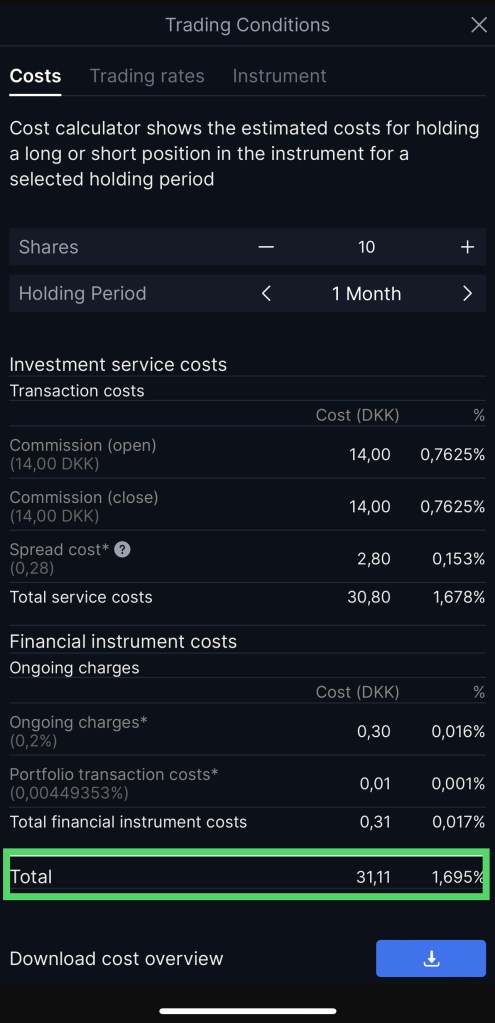
    While it’s tempting to simply calculate my transaction cost here as 14/1815.8 * 100% = 0.771%, a more realistic amount is in fact 1.695%, and arriving at this number involved a few more clicks in the app.

    Transaction costs at second glance

    Another important implication of miscalculating your transaction cost is having a cost-to-investment ratio so high that the investment takes a long time to hit breakeven.

    In a nutshell

    Always consider your transaction cost as a percentage of your total transaction amount at each DCA interval.

    If we consider purely in absolute amounts, while a transaction cost of $5000 might raise alarm bells, we might start thinking that a transaction cost of $10 is acceptable or even cheap. This is not entirely true.

    If a stock costs $100 while you have to pay $10 in transactional cost, this translates to 10% of the investment amount. Consistently paying 10% in transaction costs means losing out substantially to other DCA strategies (which becomes a hefty amount when more money is involved) and the investment having to make 10% before turning a profit.