
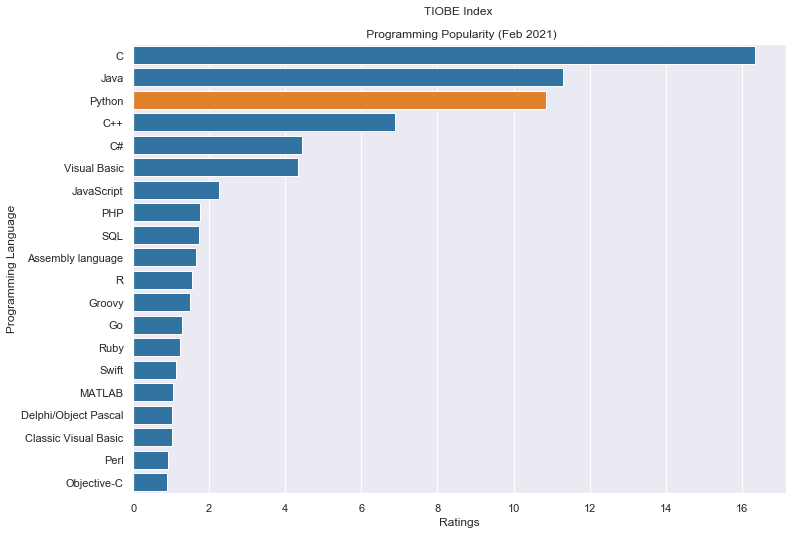
Python is third in programming language popularity and people are (literally) buying in.
On the data science front, Coursera’s lists of Top 10 Courses in 2020 and 2019 include:
- Machine Learning by Stanford University
- Programming for Everybody by University of Michigan
- AI For Everyone by DeepLearning.AI
- Algorithms by Princeton University
- What is Data Science by IBM, and the list goes on…
I get it — data science, analytics, machine learning, AI… they all sound really kewl, trendy 😎 and because they’re so heavily thrown around as buzzwords, we become curious and want a slice of the analytics pie. People around me have spoken about picking up Python, Tableau, SQL… and if you find yourself on the brink of “jumping onto the Python bandwagon” or wanting to give programming a shot, here’s a good way to get started with analytics.
Start with well–received course materials
A natural first step to begin learning anything is to sign up for a Coursera or an edX course. This is easy — you can either get acquainted with this free MIT open courseware on the Introduction to Computer Science and Programming or sign yourself up on Coursera for a well-reviewed course. I audited (the famous) CS1010S during my time in NUS.
While this is a great start, it gets increasingly difficult to follow through because your initial curiosity that prompted you to sign up for the course quickly gets extinguished by the rigour of the course content. You might find yourself zoning out, procrastinating and ultimately failing to complete the course. This happened to me when I attempted a financial engineering course on Coursera, and it brings me to the importance of a parallel point.
Envision an easy and appreciable purpose
Setting a goal for yourself to achieve using Python or another analytics tool is imperative and a good way to keep you focused and motivated as you’ll be aware of your own learning outcomes. In fact, with one, or even a series of clear, achievable purpose(s), you will realise that the course content does not immediately help you achieve your purposes, and you will have to google the rest. But what you find on Google is now a lot more understandable as you’ve progressed through your course materials, and you end up mastering more than what you had signed up for. Here’s what I mean:
Deciding a purpose
Your goal or purpose could be something as ambitious as applying text analytics on your personal credit card statements, generating stereograms, or just for starters, to simply generate the TIOBE index chart above. While it sounds innocuous and straightforward, here’s the source code to generate it:
!pip install tiobeindexpy

from tiobeindexpy import tiobeindexpy as tbpy
import seaborn as sns
import matplotlib.pyplot as plt

sns.set(style = "whitegrid")
sns.set(rc={'figure.figsize':(11.7,8.27)})

top_20 = tbpy.top_20()
top_20['Ratings'] = \
top_20.loc[:,'Ratings'].apply(lambda x: float(x.strip("%")))
top_20['Change.1'] = \
top_20.loc[:,'Change.1'].apply(lambda x: float(x.strip("%")))

labels = top_20['Programming Language']
values = top_20['Ratings']
rank = top_20['Feb 2021']

clrs = \
['tab:orange' if (x == 3) else 'tab:blue' for x in rank]
sns.barplot(x=values, y=labels, palette=clrs)\
.set_title('TIOBE Index \n\n Programming Popularity (Feb 2021)')

plt.savefig('Programming Popularity.png', bbox_inches = 'tight')
Evidently, this “simple” purpose of generating a bar chart in fact necessitates your mastery of Python’s syntax, data types, understanding how to import packages, manipulate dataframes, use anonymous functions and list comprehension. This is no mean feat, but precisely because you have a purpose/ end-goal in mind where you can visualise a working example to apply these concepts, hearing or learning about them as you progress through your course should feel more exciting and less abstract.
You’ll also realise that while your course might cover content at the conceptual level, you’ll have to google how to change the colour for a specific bar in your bar chart, how to use 2 lines for your chart header or how to change the font size of your chart labels. In this manner, your purpose will prompt you to search beyond course materials and you’ll end up learning more.
In sum
While it might be tempting to jump on the bandwagon for a programming trend that comes along, it’s more important to ask yourself first if you’re fundamentally interested and if there’s any real use for what you’re jumping onto. If you are and there is, then identify one or a few purposes and work towards them while you complete your course material.
